Income done differently
| As of January 31, 2026 |
Inception date = October 2, 2017
Past performance is not indicative of future results
Year to date
return
-0.04%
1-year
return
6.41%
3-year
return
6.87%
5-year
return
8.22%
Since
inception
8.19%
1-year distribution
rate
9.00%
Overview
The Variant Alternative Income Fund, a closed-end interval fund, offers investors efficient access to a diversified portfolio of unconventional income-generating assets. The Fund invests in niche market opportunities with strong cash flow characteristics and low correlations to public equity and bond markets. The Fund’s primary objective is to provide a high level of current income. Capital appreciation will be considered a secondary objective. Variant, an innovator in alternative income investing, is led by an investment team with decades of experience investing in market niches. Interval funds provide investors such features as daily pricing, 1099 tax reporting, and quarterly liquidity with a fund-level gate of 5-25% of NAV. The interval fund structure allows investors the opportunity to access less liquid, potentially higher yielding alternative investments.
Portfolio
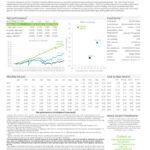
Portfolio composition by asset class
Performance
| As of January 31, 2026 |
Inception date = October 2, 2017
Since inception return
Net performance
| 1 yr | 3 yr | 5 yr | SI | |
|---|---|---|---|---|
| Variant | NICHX | 6.41% | 6.87% | 8.22% | 8.19% |
| T-bills | BBG 1-3 Mo | 4.22% | 4.88% | 3.24% | 2.57% |
| IG bonds | BBG Agg | 6.85% | 3.65% | -0.20% | 1.73% |
| High yield | BBG HY | 7.70% | 8.88% | 4.54% | 5.06% |
| Equity | S&P 500 | 16.32% | 21.08% | 14.95% | 14.78% |
Monthly returns
| Jan | Feb | Mar | Apr | May | Jun | Jul | Aug | Sep | Oct | Nov | Dec | YTD | |
|---|---|---|---|---|---|---|---|---|---|---|---|---|---|
| 2017 | 0.12 | 0.19 | 0.42 | 0.73 | |||||||||
| 2018 | 0.63 | 0.31 | 0.11 | 0.48 | 0.62 | 0.87 | 0.84 | 0.44 | 0.47 | 0.64 | 0.87 | 0.74 | 7.26 |
| 2019 | 0.48 | 0.59 | 1.98 | 0.82 | 1.05 | 1.07 | 1.35 | 1.07 | 0.52 | 0.76 | 0.64 | 1.24 | 12.22 |
| 2020 | 1.17 | 0.48 | -0.50 | -0.27 | 0.87 | 0.34 | 0.76 | 0.08 | 0.56 | 0.72 | 0.45 | 1.06 | 5.87 |
| 2021 | 1.10 | 0.94 | 0.92 | 0.90 | 1.59 | 0.96 | 1.72 | 0.72 | 0.65 | 0.72 | 0.72 | 0.72 | 12.29 |
| 2022 | 0.68 | 0.60 | 0.72 | 0.86 | 0.49 | 0.63 | 0.57 | 0.88 | 0.77 | 0.81 | 0.49 | 0.89 | 8.71 |
| 2023 | 0.77 | 0.69 | 0.61 | 0.59 | 0.76 | 0.71 | 0.93 | 0.58 | 0.76 | 0.82 | 0.78 | 1.09 | 9.50 |
| 2024 | 0.60 | 0.67 | 0.91 | 0.81 | -3.19 | 0.78 | 0.81 | 0.58 | 0.63 | 0.77 | 0.77 | 0.69 | 4.87 |
| 2025 | 0.67 | 0.41 | 0.61 | 0.49 | 0.26 | 0.67 | 0.60 | 0.45 | 0.96 | 0.64 | 0.56 | 0.62 | 7.16 |
| 2026 | -0.04 | -0.04 |
Year to date returns
| NICHX | BBG Agg | BBG HY | S&P 500 | |
|---|---|---|---|---|
| Q417 | 0.73 | 0.39 | 0.47 | 6.64 |
| 2018 | 7.26 | 0.01 | -2.08 | -4.39 |
| 2019 | 12.22 | 8.72 | 14.32 | 31.48 |
| 2020 | 5.87 | 7.51 | 7.11 | 18.39 |
| 2021 | 12.29 | -1.54 | 5.28 | 28.68 |
| 2022 | 8.71 | -13.01 | -11.19 | -18.13 |
| 2023 | 9.50 | 5.53 | 13.45 | 26.26 |
| 2024 | 4.87 | 1.25 | 8.19 | 25.00 |
| 2025 | 7.16 | 7.30 | 8.62 | 17.86 |
| 2026 | -0.04 | 0.11 | 0.51 | 1.44 |
The performance data quoted represents past performance and is no guarantee of future results. Investment return and principal value of an investment will fluctuate so that an investor’s shares, when redeemed, may be worth more or less than their original cost. Current performance may be lower or higher than the performance data quoted. Returns assume reinvestment of dividends and capital gains.
Fund Highlights
| As of January 31, 2026 |
| Fund structure | Interval closed-end fund |
| Fund assets | $2,564 million |
| Subscriptions / NAV | Daily |
| Redemptions | Qtrly 5% of Fund NAV |
| Management fee | 0.95% |
| Share class | Institutional |
| Ticker / CUSIP | NICHX / 92220Q103 |
| Fund launch | October 1, 2018 |
| Min. investment | $1,000,000 (Firm level) |
| Gross expense ratio | 2.12% |
| Net expense ratio | 2.12% |
| Administrator | UMB Fund Services |
| Counsel | Faegre Drinker |
| Auditor | Cohen & Company |
| Distributor | Distribution Services, LLC |
| Distributions | Quarterly |
| Tax reporting | 1099 |
Documents
California Lender License Number: 60DBO-185300
The Variant Alternative Income Fund (the “Fund”) is a continuously-offered, non-diversified, registered closed-end fund with limited liquidity. There is no guarantee the Fund will achieve its objective. An investment in the Fund should only be made by investors who understand the risks involved, who are able to withstand the loss of the entire amount invested and who can bear the risks associated with the limited liquidity of Shares.
Important Risks: Shares are an illiquid investment. You should generally not expect to be able to sell your Shares (other than through the repurchase process), regardless of how the Fund performs. Although the Fund is required to implement a Share repurchase program only a limited number of Shares will be eligible for repurchase by the Fund.
An investment in the Fund is speculative, involves substantial risks, including the risk that the entire amount invested may be lost, and should not constitute a complete investment program. The Fund may leverage its investments by borrowing, use of swap agreements, options or other derivative instruments. The Fund is a non-diversified, closed-end management investment company, meaning it may be more susceptible to any single economic or regulatory occurrence than a diversified investment company. In addition, the fund is subject to investment related risks of the underlying funds, general economic and market condition risk.
Alternative investments provide limited liquidity and include, among other things, the risks inherent in investing in securities, futures, commodities and derivatives, using leverage and engaging in short sales. The Fund’s investment performance depends, at least in part, on how its assets are allocated and reallocated among asset classes and strategies. Such allocation could result in the Fund holding asset classes or investments that perform poorly or underperform. Investments and investment transactions are subject to various counterparty risks. The counterparties to transactions in over the-counter or “inter-dealer” markets are typically subject to lesser credit evaluation and regulatory oversight compared to members of “exchange-based” markets. This may increase the risk that a counterparty will not settle a transaction because of a credit or liquidity problem, thus causing the Fund to suffer losses. The Fund and its service providers may be prone to operational and information security risks resulting from breaches in cyber security. A breach in cyber security refers to both intentional and unintentional events that may cause the Fund to lose proprietary information, suffer data corruption, or lose operational capacity.
BEFORE INVESTING YOU SHOULD CAREFULLY CONSIDER THE FUND’S INVESTMENT OBJECTIVES, RISKS, CHARGES AND EXPENSES. THIS AND OTHER INFORMATION IS IN THE PROSPECTUS, A COPY OF WHICH MAY BE OBTAINED FROM (877) 770-7717 OR WWW.VARIANTINVESTMENTS.COM. PLEASE READ THE PROSPECTUS CAREFULLY BEFORE YOU INVEST.
The Fund is distributed by Distribution Services, LLC. Variant Investments, LLC (the “Investment Manager”) serves as the investment manager of the Fund. Distribution Services, LLC and the Investment Manager are unaffiliated.


